Visit Map Here!
Welcome to University of Minnesota Ethnicity 2013-2015.
This analysis is basically to understand if there is a pattern in choosing education trade and ethnicity. Being an international student I know how cultural background can change the way you think. I have personally experienced this and always had a question about how culture influences human behavior. While growing up and learning Indian history, I found the relation how a doctor’s son will be a doctor or how children follow or are supposed to follow what their ancestors did. Eventually, development and evolving led people to choose different trades and the pattern changed over time. This analysis can help us understand how ethnicity of an individual may result in the change in determining education and the patterns in it. This investigation will allow us to understand the reasons behind the human behavior. Example Asians are more inclined to choose science, engineering or mathematical trades. Is this because of the culture, environment or the job opportunities available around or anatomy of the brain - that they are good in the particular area? There can be many different reasons and to start looking for answers, one can start from analyzing the relationship between Ethnicity and education one chooses to help solve these mysteries.
Objective of the analysis:
To learn about the diverse population around the campus To visualize the Ethnicity patterns To study the pattern respect to the level of studies and departments To analyze the relationship between the ethnicity and the trade
Data source
I have received the data from the Office of Institutional Research department of the University of Minnesota. The U policy on student data privacy does not allow to share the records with ethnicity head count below 5. So this data represents and approximate visualization and can be used as a general reference map.
The department information is received from Facility management, UServices. This data consist of the department information like OBJECTID,Dept_by_building_BUILDING,Dept_by_building_DEPTID,Dept_by_building_DEPT_DESC, Structure_Footprint_CAMPUS_NUMBER,Structure_Footprint_BUILDING_NUMBER,Structure_Footprint_NAME, Structure_Footprint_NAME_ABBREV,Structure_Footprint_NAME_ALTERNATE,Structure_Footprint_ADDRESS1, Structure_Footprint_ADDRESS2,Structure_Footprint_CITY,Structure_Footprint_STATE,Structure_Footprint_ZIP, Structure_Footprint_SITE_BLDG,Structure_Footprint_ACCESSIBLE_YN,Structure_Footprint_MAP_URL_SMALL, Structure_Footprint_MAP_URL_LARGE,Structure_Footprint_GOOGLEMAP_URL,Structure_Footprint_BLDGPAGE_URL, Structure_Footprint_BLDG_PHOTO_URL,Structure_Footprint_Shape_Length,Structure_Footprint_Shape_Area, Structure_Footprint_X,Structure_Footprint_Y.
I have selected Cartodb as the web mapping platform. I considered using ArcGIS online as well. However, I was able to get more animations in Cartodb than ArcGIS online.
Joining the data wasn't easy
Bring this two different data sets together was not an easy task. As the footprint structure layer of the university only consists of the building information represented in polygons and not the department level spatial information. I had to create points for each building and its related departments. I tried to automate the process using create random points, but this didn't allow me to get the relevant information. It produced points but didn't have any information other than object id, which was not useful at all. So finally I digitized the data in ArcMap and got a level department footprints.
Department data allows representing the ethnicity data spatially. I have used building footprints layer to locate the units spatially. Some departments do not have specific location due to privacy policies, so those are placed in the relevant areas.
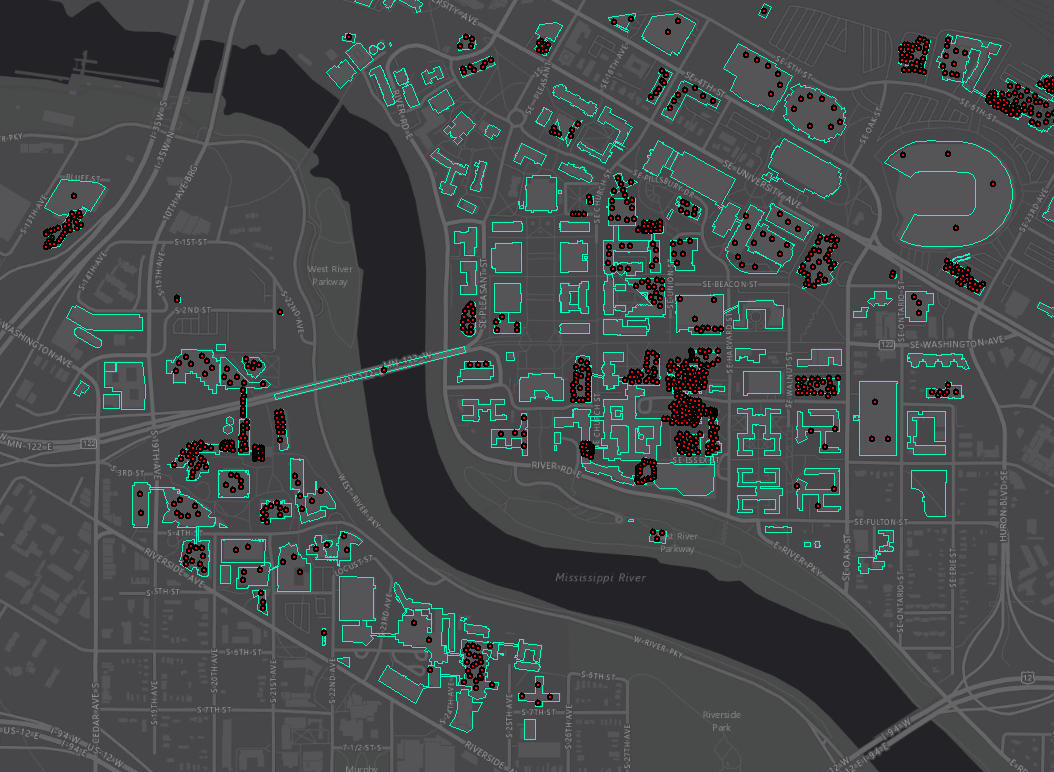
Now this department point features had to be further divided into Ethnicity. This field consisted of eight coded values as given below.
That meant dividing those departments further into 8; It sounds simple, but the ethnicity data was made up of different levels like Grad, Undergrad, Professional, Nondegree. This whole data set was for three years. Cleaning up the data was most important and time-consuming task. Final Ethnicity department level layer consists of 1976 records.
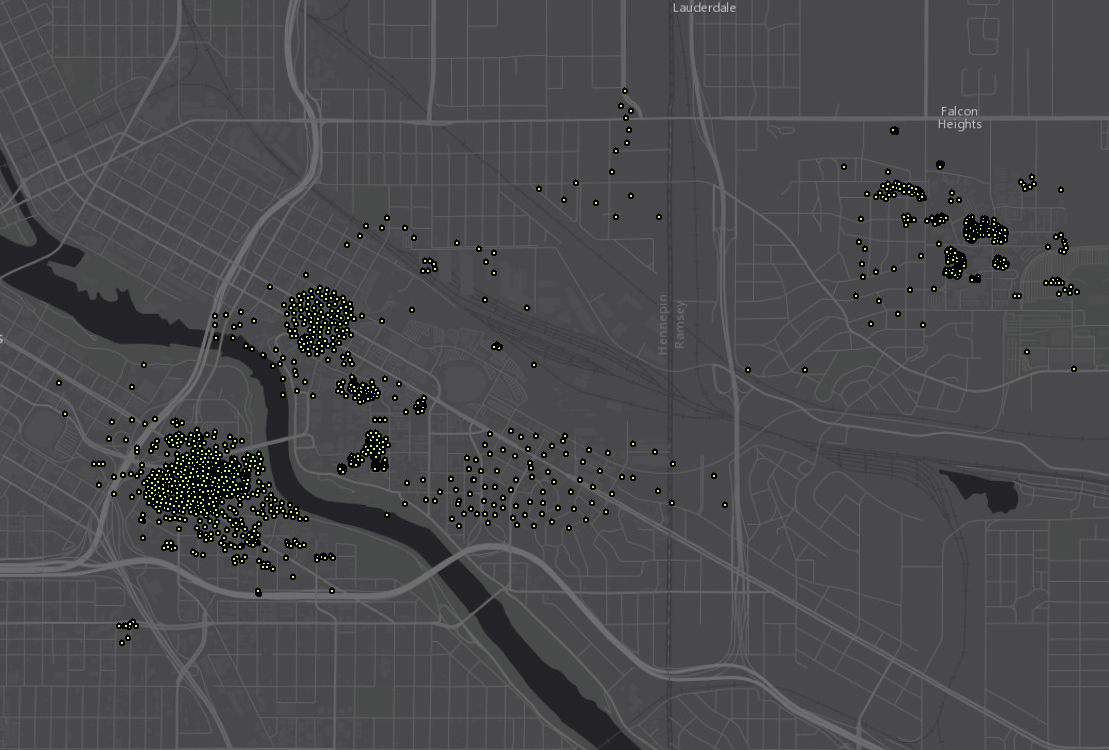
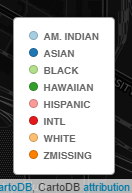
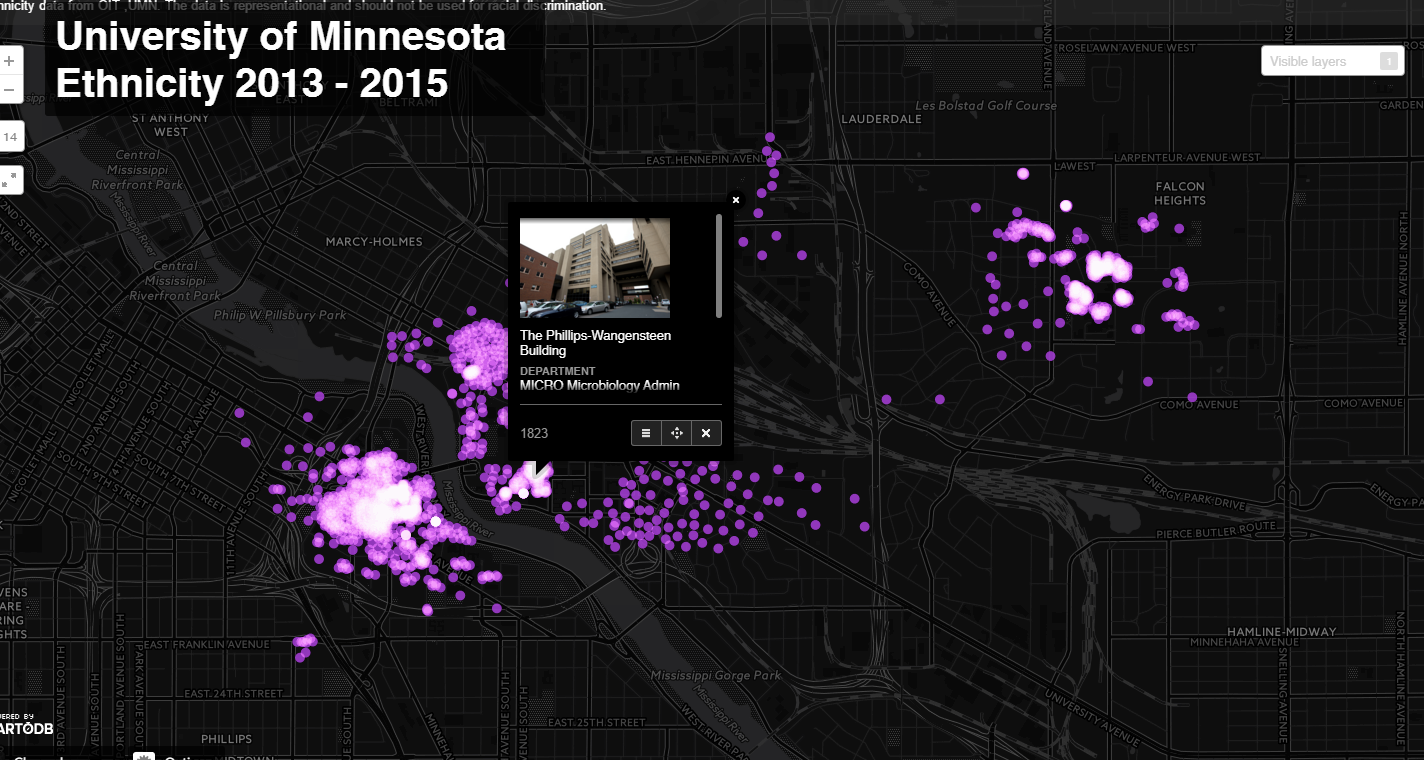
I used Carto DB to develop the final web map, the layers in the map are Yearly Department level ethnicity ( the layer is time enabled), Ethnicity data (simple map), Ethnicity heat map. Both layers except the time-enabled layer to have pop-ups with information regarding the building, department, Ethnicity, term, headcount, buildings detail page and a photo. Some of the snapshots of the map:
Conclusion:
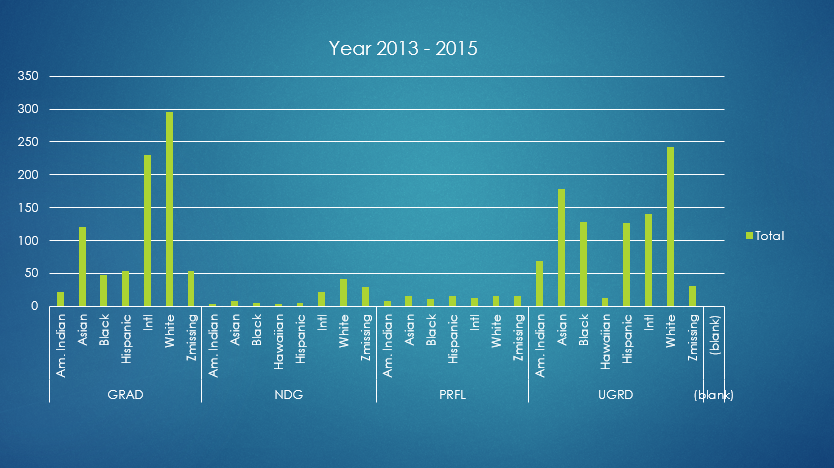
The data analysis shows the following results for 2013 – 2015 which depicts some patterns like international students going for Grad studies as compared to other. Black ethnicity students are going for undergrads more compared to grad studies. The Hispanic population more in undergrad compared to other levels of education etc. For detail of the ethnicity pattern, these results can further be categorized. This study is not for racially discriminating any ethnic group but to know the reasons and to bring in resources to the students of a particular ethnicity. It allows us to understand the diverse culture of the university and how the university can help students to learn more about different cultures which would assist them to understand and respect different ethnicity.
The data analysis shows the following results for 2013 - 2015
Future scope:
We can bifurcate departments into more general categories like Arts, Science, Engineering, Commerce, Human Resources, etc. That will allow us to aggregate the students in these different groups and ethnicity. This analysis gives a broader perspective of ethnicities leaning towards some specific trades.
Authors and Contributors
For more information you can contact me on Github @sangl003 or @ sangl003@umn.edu
Support or Contact
Having trouble with Pages? Check out our documentation or contact support and we’ll help you sort it out.